I've been into investing for a number of years. Of course, I can't afford to save much, but I save as much as I possibly can. It's actually over 10% of my paycheck when you add all of the pieces up.
About 10 years ago, I opened an account at Sharebuilder, a local online brokerage firm that I looked at and decided to support with my business. It was easy, but the amount of money I had available was really low. They didn't mind. Over the next 4 years, I slowly added a small amount of money each month, sometimes skipping several months when things were tight. Then in early 2004 I had a CD mature, and I put a thousand dollars into AT&T, right when it was merging with Southern Bell. I started getting significant dividends from that. Ok, "significant" for me — most people wouldn't consider these numbers to be that impressive. But it got me thinking.
I opened an account for each of my sons, and started saving a little bit into those. I got hit hard when Shea's biggest stock, GM, went under. But whatever. That's the market. It was also nice when Microsoft started paying dividends.
I kept coming back to dividends. I know that there were stories coming out of the Great Depression that the stocks where the price had collapsed kept doing business, kept making profits, and kept paying dividends. A modest investment made in the late 1920s, if the investor didn't get cold feet, came up to quite a revenue stream in the 1980s by reinvesting their dividends every quarter.
Then Google launched Google Finance. I'd been using Yahoo Finance for a while to track things, but they stopped trying to expand their service and I moved away from them. Google put up dynamic charts where I could see what the trends had been, and what the dividends had been. New research tools gave new ways of seeing the same data that I remember my grandfather poring over as I was growing up. Then I heard about something else: monthly stock dividends.
There are quite a few companies, or exchange traded funds, that pay their dividends not on a quarterly basis, but monthly. This increases the compounding quite substantially. So I started looking for them. I found some lists, combined them, filled in the blanks, looked at the calculations for dividend yield and return, and started coming up with a plan. I still didn't have a whole lot of money to play with, but I decided to play with what I had.
The Snowball Scheme
The trick was to stop looking at the account balance and the stock price. If you're going to invest for dividends, you are going to be holding on to the stock. And when I really started studying and planning, we had just entered the latest downturn in the market where stock prices were going down into Davy Jones' Locker. But a lot of them were still doing business, still making profits, and just like during the Great Depression, still paying dividends. Even the monthly dividend stocks didn't skip that much — maybe a month here or there, maybe an adjustment downward, but they didn't stop paying. There are right now over 400 stocks that pay dividends on a monthly basis.
What I eventually landed on was a snowball scheme. I say "scheme" because it's a fun word to use — makes people think of shady secrets and exclusivity. It's not. It's just a word. Here is how it works.
Say you have 3 stocks: AAA, BBB, and CCC. Each one pays a dividend, each one has a price, and say they all pay their dividend monthly.
| Stock | Dividend | Price | Frequency |
|---|---|---|---|
| AAA | $0.10 | $10.00 | 12 |
| BBB | $0.08 | $12.50 | 12 |
| CCC | $0.15 | $25.00 | 12 |
From this data we can calculate the Calculated Yield.
| Stock | Dividend | Price | Frequency | Calculated Yield |
|---|---|---|---|---|
| AAA | $0.10 | $10.00 | 12 | 12.00% |
| BBB | $0.08 | $12.50 | 12 | 7.68% |
| CCC | $0.15 | $25.00 | 12 | 7.20% |
This is actually fairly typical. The range of dividend yields on my list of monthly dividend stocks averages between 6% and 7%.
I set my goal as earning $100 in dividends per year from as many stocks as possible. So we need to add a few more columns to the table.
| Stock | Dividend | Price | Frequency | Calc. Yield | Shares for $100/yr | Capital Needed |
|---|---|---|---|---|---|---|
| AAA | $0.10 | $10.00 | 12 | 12.00% | 83.33 | $833.33 |
| BBB | $0.08 | $12.50 | 12 | 7.68% | 104.17 | $1,302.08 |
| CCC | $0.15 | $25.00 | 12 | 7.20% | 55.56 | $1,388.89 |
So, what do we do with all of this? These examples show that in order to collect $100 from stock AAA, we need to purchase $833.33 worth of stock to buy 83.33 shares. In Sharebuilder, you could set automatic deposits and automatic investments. Once you hit the $100 milestone from one stock, you shift new capital toward the next one on your list. You can do this with Blue Chips, Renewable Energy stocks, or any other type of stock list.
Does it work?
You tell me:
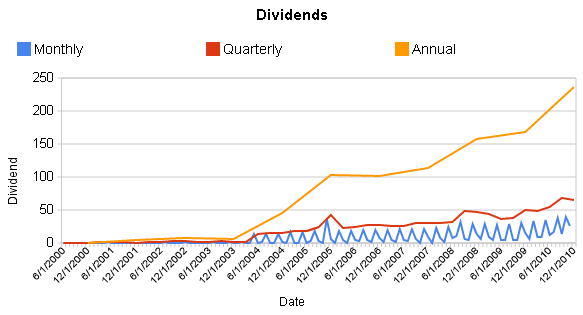
I'm preserving this page because it's part of the honest origin story of Total Growth Investing. The discipline shown here — tracking every dividend from the very beginning, building systematic tables, setting measurable milestones — was right all along. What I got wrong was the target: I was optimizing for current yield and monthly payout frequency, not for dividend growth, price growth, or payout sustainability. The snowball was real. It was just rolling downhill. The TGI methodology corrects the aim, not the habit. If you want to see what Account A looks like today, visit the Results page.